A few years ago, 3D models of HVAC systems were almost unheard of. Two-dimensional drawings were required (plans and sections) leaving the acoustic consultant with a real puzzle to decipher… often at the very last minute, once the HVAC design was completed, documented, and transmitted.
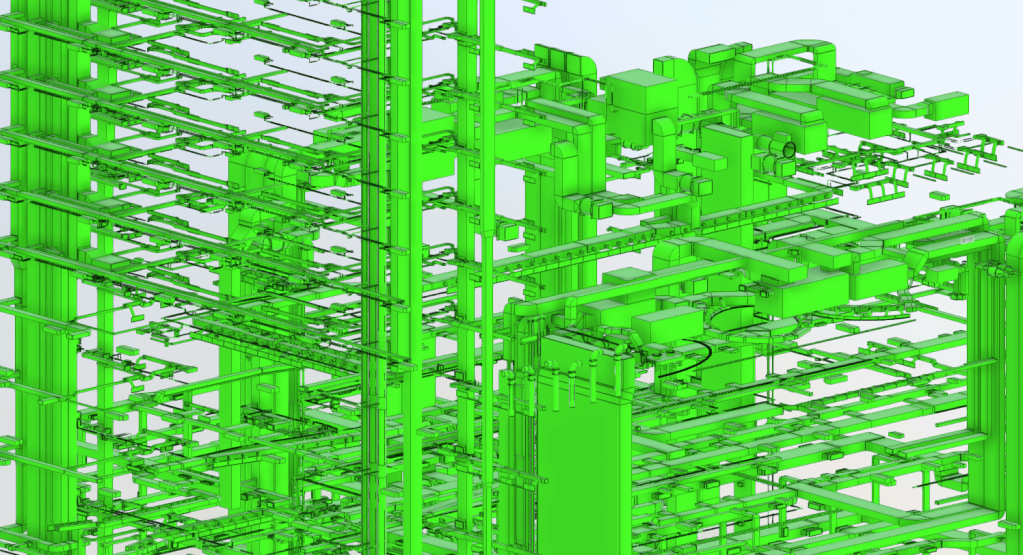
BIM has changed the game. Even when the design is still evolving, it is now much easier to identify noise sources in the system, transmission paths, troublesome branches, and unfortunate balancing dampers. The whole system is there to be read as one builds the calculation. One plug-in later, and the entire route is mapped out, velocities checked, and ready for assessment.
There are still thousands of challenges with BIM models. One of them is the affordability of software packages. Another is the cost of training. We have heard these concerns for years, yet little has changed. Large projects still rely on the same platforms, and design teams are expected to be equipped, licensed, and proficient with the right package, the correct version, and compatible workflows.
At ARD, we invested because our projects and our clients expected it. And it has paid off: hours saved, earlier insights, and more timely advice when something “not quite right” appears between two model versions. We are far more familiar with the systems as a result, and this shows in the advice we give.
Complex systems still take time to process, and the quality of the output always depends on the quality of the input, not just the 3D model, but also the noise data behind it. Yet we can honestly say that the task has become far easier, and far clearer, than it ever was before.
No, spaghettis are not scary anymore.